Social media ideas for colleges and universities
The post categories, hashtags and posting times higher education accounts are actually using, ranked from thousands of tracked college and university accounts. Every figure on this page recomputes daily.
Updated October 18, 2026
Standout posts to learn from
Posts an AI picked from yesterday's higher education feed for being unusual or well made, not for raw reach. Steal the format, not the caption.
@
1 day ago

@
about 18 hours ago

@
about 19 hours ago
Coming up
The next dates on the higher education calendar: holidays, awareness days and months, and the unofficial ones students actually post about. Plan the post a week out.
- THIS MONTHAwareness
Breast Cancer Awareness Month
October 2026
- THIS MONTHAwareness
LGBTQ+ History Month
October 2026
- TOMORROWAwareness
National Transfer Student Week
Mon, Oct 19
The post categories higher ed uses most
Share of posts from tracked main institutional accounts over the last month, with each category's average engagement rate. The most-posted category is rarely the best-performing one.
Top 10 Instagram post categories for colleges and universities
- 1
Open House/Campus Event Promotion
Post the schedule as a carousel and put the parking answer on slide two.
23.8% of posts1.1% engagement rate · 10,411 posts - 2
Campus Life
Whatever happened on the quad today, posted today.
12.6% of posts3.6% engagement rate · 5,524 posts - 3
Campus Traditions
Film the tradition from a first-year's point of view, then explain its origin in the caption.
10.8% of posts2.6% engagement rate · 4,739 posts - 4
Athletic
Cut game-day energy into a reel, then feature one athlete's story away from the sport.
9.8% of posts2.6% engagement rate · 4,311 posts - 5
Homecoming
Pair a photo from this year's homecoming with the same spot decades ago.
7.8% of posts2.4% engagement rate · 3,409 posts - 6
Current Student Features
Let a student answer why they chose this place unscripted, in their own words.
6.8% of posts1.9% engagement rate · 2,988 posts - 7
Academic Content
Turn one lecture moment into a thirty-second explainer from the professor who teaches it.
6.7% of posts1.5% engagement rate · 2,940 posts - 8
Resources/Tips
One tip per post, in plain language, naming a resource a student can search for.
5.7% of posts1.1% engagement rate · 2,512 posts - 9
Current Events / Pop Culture
Answer the week's pop-culture moment with a campus angle inside two days.
4.8% of posts2.5% engagement rate · 2,083 posts - 10
Official Announcement
Lead with the one line a student would screenshot; put the policy detail in the caption.
4.7% of posts1.6% engagement rate · 2,078 posts
Top 10 Facebook post categories for colleges and universities
- 1
Open House/Campus Event Promotion
Post the schedule as a carousel and put the parking answer on slide two.
18.4% of posts0.2% engagement rate · 2,792 posts - 2
Campus Life
Whatever happened on the quad today, posted today.
10.0% of posts0.3% engagement rate · 1,517 posts - 3
Campus Traditions
Film the tradition from a first-year's point of view, then explain its origin in the caption.
9.6% of posts0.4% engagement rate · 1,446 posts - 4
Athletic
Cut game-day energy into a reel, then feature one athlete's story away from the sport.
8.1% of posts0.3% engagement rate · 1,228 posts - 5
Research & Innovation
Show the lab, the person and the question in three shots; skip the press release.
7.6% of posts0.2% engagement rate · 1,150 posts - 6
Homecoming
Pair a photo from this year's homecoming with the same spot decades ago.
7.5% of posts0.3% engagement rate · 1,136 posts - 7
Academic Content
Turn one lecture moment into a thirty-second explainer from the professor who teaches it.
7.4% of posts0.2% engagement rate · 1,114 posts - 8
Current Student Features
Let a student answer why they chose this place unscripted, in their own words.
6.7% of posts0.2% engagement rate · 1,009 posts - 9
Official Announcement
Lead with the one line a student would screenshot; put the policy detail in the caption.
6.5% of posts0.3% engagement rate · 982 posts - 10
Alumni Features
Where they are now in one line, what they studied in the next.
5.9% of posts0.3% engagement rate · 898 posts
Top 10 TikTok post categories for colleges and universities
- 1
Campus Life
Whatever happened on the quad today, posted today.
21.4% of posts3.9% engagement rate · 1,027 posts - 2
Memes/Comedy
Take the meme format trending this week and swap in a campus-specific punchline.
11.5% of posts5.9% engagement rate · 554 posts - 3
Open House/Campus Event Promotion
Post the schedule as a carousel and put the parking answer on slide two.
11.5% of posts3.7% engagement rate · 551 posts - 4
Campus Traditions
Film the tradition from a first-year's point of view, then explain its origin in the caption.
9.4% of posts13.7% engagement rate · 452 posts - 5
Aesthetic Content
A golden-hour campus shot with no text overlay; let the caption do the work.
8.6% of posts3.8% engagement rate · 411 posts - 6
Athletic
Cut game-day energy into a reel, then feature one athlete's story away from the sport.
8.4% of posts5.5% engagement rate · 403 posts - 7
Homecoming
Pair a photo from this year's homecoming with the same spot decades ago.
7.7% of posts3.4% engagement rate · 369 posts - 8
Current Student Features
Let a student answer why they chose this place unscripted, in their own words.
6.9% of posts2.8% engagement rate · 331 posts - 9
Resources/Tips
One tip per post, in plain language, naming a resource a student can search for.
5.7% of posts2.8% engagement rate · 272 posts - 10
Current Events / Pop Culture
Answer the week's pop-culture moment with a campus angle inside two days.
5.1% of posts6.3% engagement rate · 247 posts
Today's Top Posts in Higher Ed
The highest engagement rate on each platform in the last daily snapshot — what beating the benchmark actually looks like
@
about 19 hours ago
@
about 21 hours ago

@
1 day ago
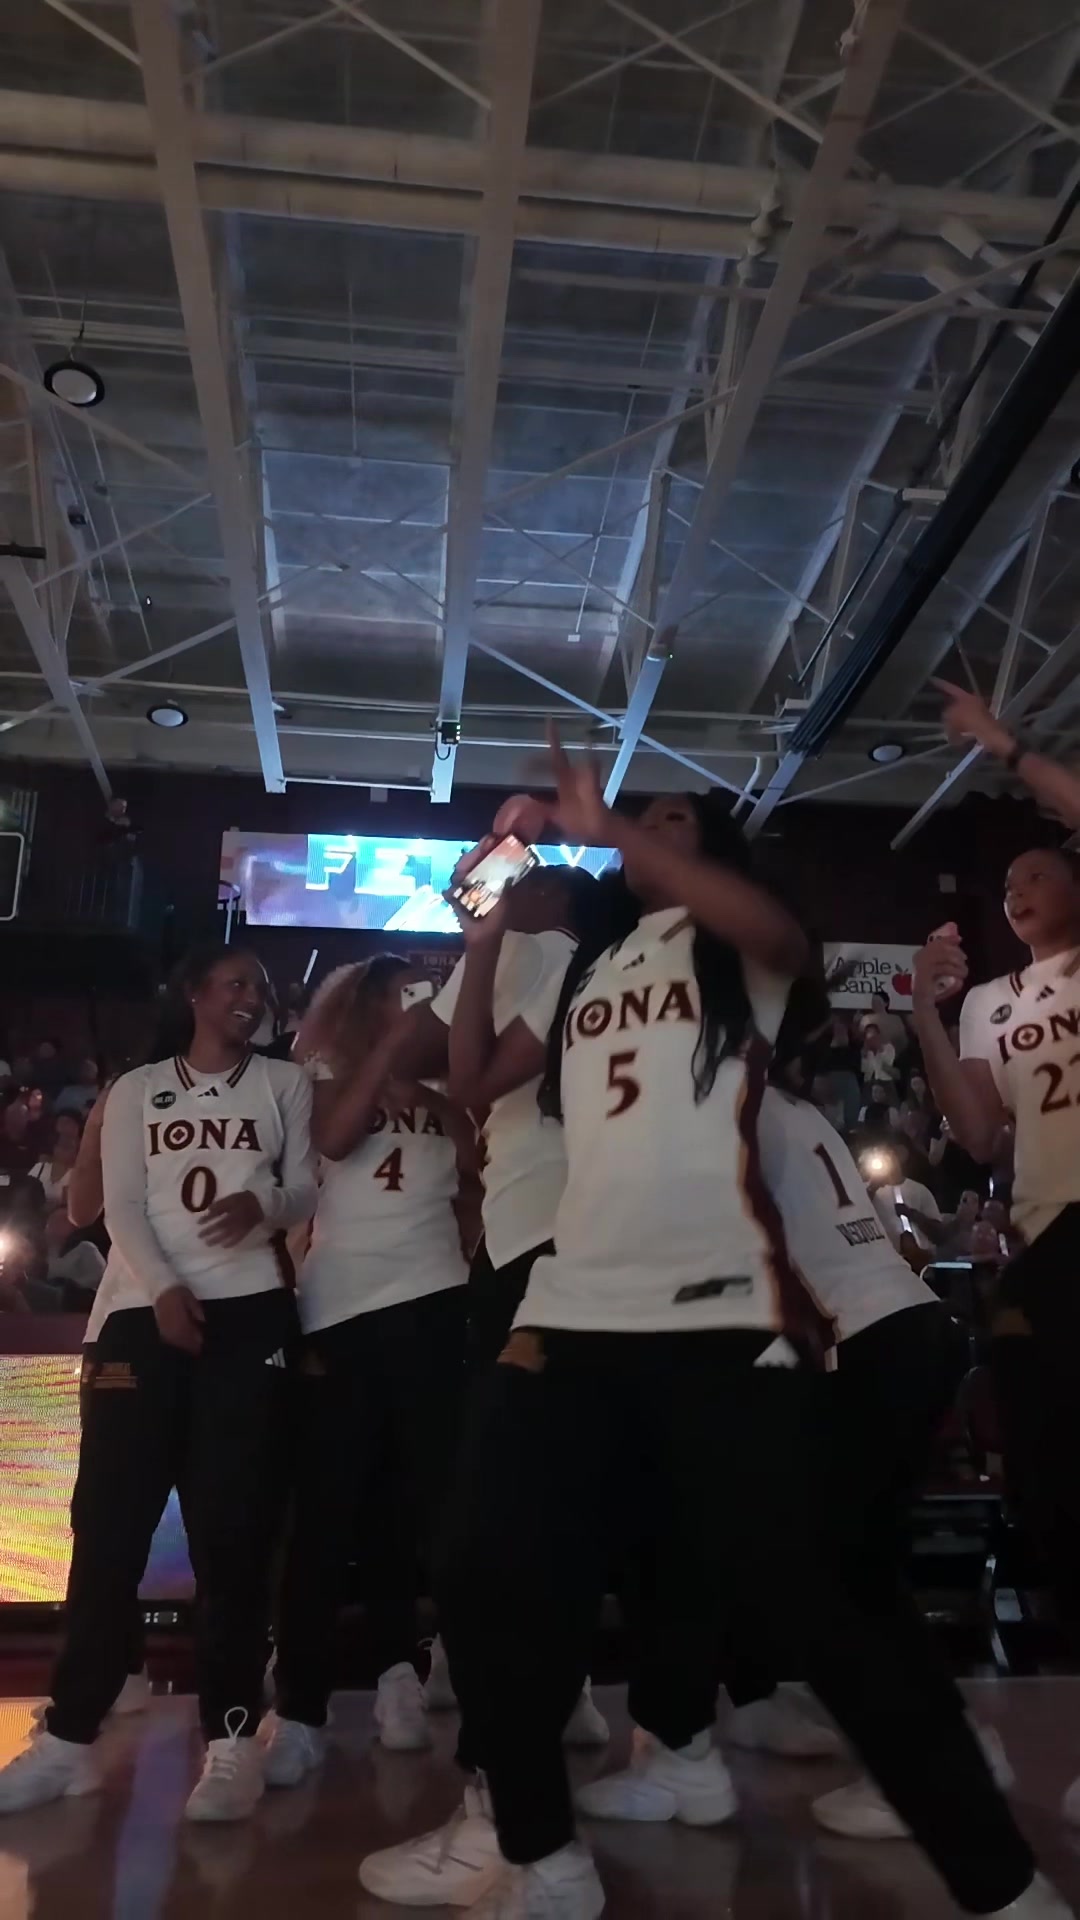
This is one slice of Today's Snapshot
The full daily report adds AI-picked standout posts, trending hashtags, fastest-growing schools, and engagement by content type — refreshed every morning at 9 AM ET.
Get next week's ideas before you need them
The Reach Report brings platform changes, the campus posts that performed, and fresh benchmark data every Monday — from the team behind these rankings.
One email Monday morning. Unsubscribe anytime.
When higher ed accounts post
When main institutional accounts post
Peak · Fri 12 PMMain institutional accounts post most on Fridays between 9 AM and 1 PM local time, across 2,320 tracked accounts.
See which of these ideas your account is missing
The free opportunity assessment scores your institution's accounts against peers on growth, engagement and content gaps, in about a minute.
Go deeper
For running the accounts themselves, see social media management for higher education. The full Instagram benchmarks and today's snapshot go deeper on every figure here.
Frequently asked questions
The ranked list above is the answer for this month: the categories tracked institutional accounts post most, each with its share of posts and average engagement rate. The best idea is a high-engagement category your own account under-posts.
Student-led formats (features, day in the life, ambassador content) and campus moments usually out-engage announcements, which are posted far more often. Compare the share column against the engagement column above to find the gap.
The trending list above is recomputed daily from the past week of posts across tracked accounts, ranked by week-over-week growth. Each entry links to the most engaging post carrying it.
The heatmap above shows when tracked accounts actually post, in each school's own local time, with the peak weekday and hour called out. Treat it as where the competition for attention is, not as a rule.
Reach tracks thousands of college and university accounts across Instagram, Facebook and TikTok and recomputes these figures daily. Category shares come from the last month of main institutional Instagram posts; hashtags and top posts come from the daily snapshot.
See where your team stands
Reach measures how higher education social teams actually post, so you can compare your own accounts against the cohorts these figures come from and see the gap in your own numbers.
Get it in your inbox
Never miss a trend, campaign, or idea from across higher ed social. Join enrollment and marketing teams reading The Reach Report.
One email Monday morning. Unsubscribe anytime.
A team building with higher-ed, for higher-ed
You get more than a platform — you get a team that speaks your language and listens to you.
MeetYourClass team has spent years in enrollment, social media, and data science — so you're never explaining your world to someone who hasn't lived it. Flag something and you're talking to the people who build the product.
From the team trusted by the marketing, social media, and enrollment teams at many of the nation's leading universities: